Food cost is one of the most important KPIs in hospitality. It tells you how much of your revenue goes toward purchasing ingredients. Yet many hospitality operators don't know exactly what their food cost percentage is. That's a costly blind spot that loses money every single day.
1. What exactly is food cost?
Food cost is the percentage of your revenue that you spend on ingredients and raw materials. If you purchase €100 worth of ingredients and generate €300 in revenue from them, your food cost is 33 percent. Simple in theory, but tricky in practice, especially if you have an extensive menu with fluctuating purchase prices.
The formula: Food cost percentage = (Total Ingredient Purchase Costs ÷ Total Revenue) × 100. Example: €8,500 Purchases ÷ €28,000 Revenue × 100 = 30.4%.
What is a healthy food cost?
Benchmarks vary by type of hospitality business. For a restaurant with fresh dishes, a healthy food cost is between 25 and 35 percent. A bar or café with a high proportion of drinks sits lower, around 18 to 25 percent, because beverages carry higher margins.
- Restaurant: 28–35%
- Cafe / brasserie: 25–35%
- Fast food / take-away: 25–35%
- Catering: 25–30%
- Hotel restaurant: 25–35%
2. Navigating Competition: Price Elasticity of Demand
In high density markets, operators often consider lowering menu prices to capture market share from local competitors. To do this safely, you must understand Price Elasticity of Demand (PED), which evaluates how sensitive your customer volume is to a price adjustment.
The formula: Price Elasticity = Percentage of Change in Customer Volume ÷ Percentage of Change in Price.
If you reduce the price of a burger combo from €12.00 to €10.20 (a 15% price cut), and your weekly volume increases from 500 to 650 covers (a 30% volume growth), your elasticity score is 2.0. Because the result is greater than 1, your market is considered highly elastic, meaning customers are responsive to price drops.
3. The Discount Trap: Calculating Break-Even Volume
While gaining more customers looks positive, a price reduction shrinks your Gross Profit per unit while your raw ingredient costs remain completely identical. To maintain your baseline profitability, you must calculate your new Break-Even Volume.
The formula: Required Target Customer Volume = Current Total Gross Profit ÷ New Gross Profit Per Unit.
Using the burger scenario above with a static €4.00 ingredient cost:
- Original Profit: 500 customers × €8.00 margin = €4,000 total profit
- New Profit per Unit: €10.20 new price - €4.00 ingredient cost = €6.20 margin
- Break-Even Target Volume: €4,000 ÷ €6.20 = 646 customers
To make the exact same profit as before, you must serve 146 additional covers, bringing you to 646. In the elasticity example above the price cut drew you to 650, so you only just clear that line. And a busier dining room brings hidden costs of its own: added strain on your kitchen staff and potentially higher labour expenses. A fuller room does not automatically mean higher net returns, so it is crucial to weigh these factors before experimenting with prices.
4. Tracking Food Cost in Real Time
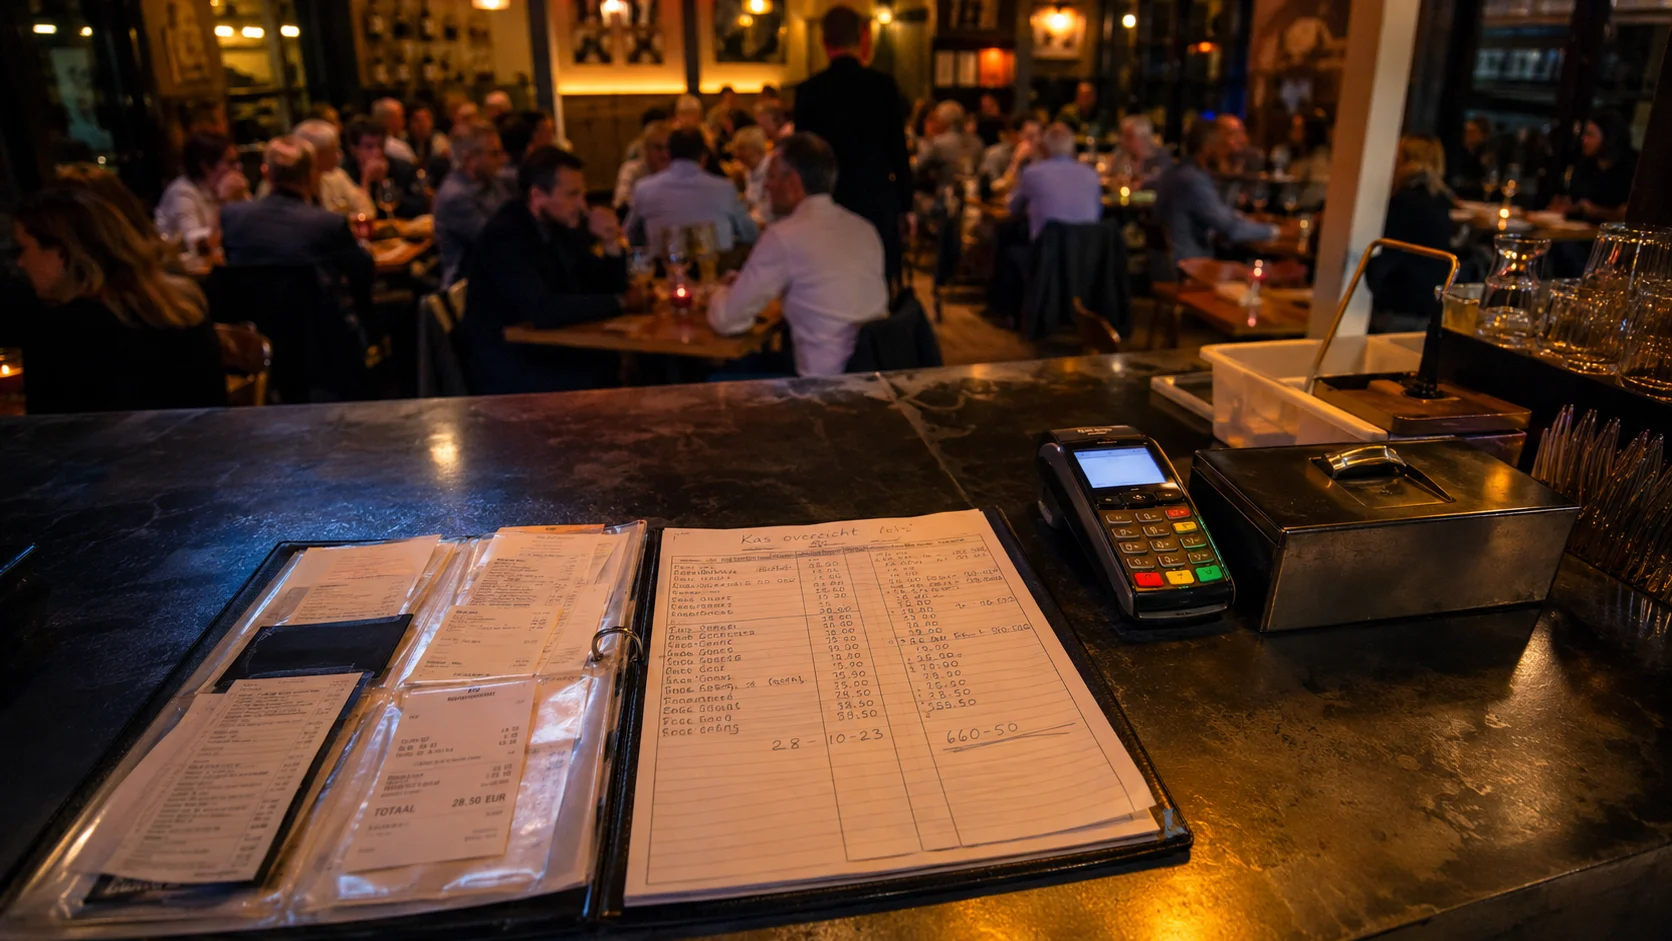
Manually calculating these shifting variables across fluctuating supplier prices and busy service hours is nearly impossible. If you only discover at the end of the month that a price experiment pushed your food cost to 40 percent, the damage to your bottom line is already done.
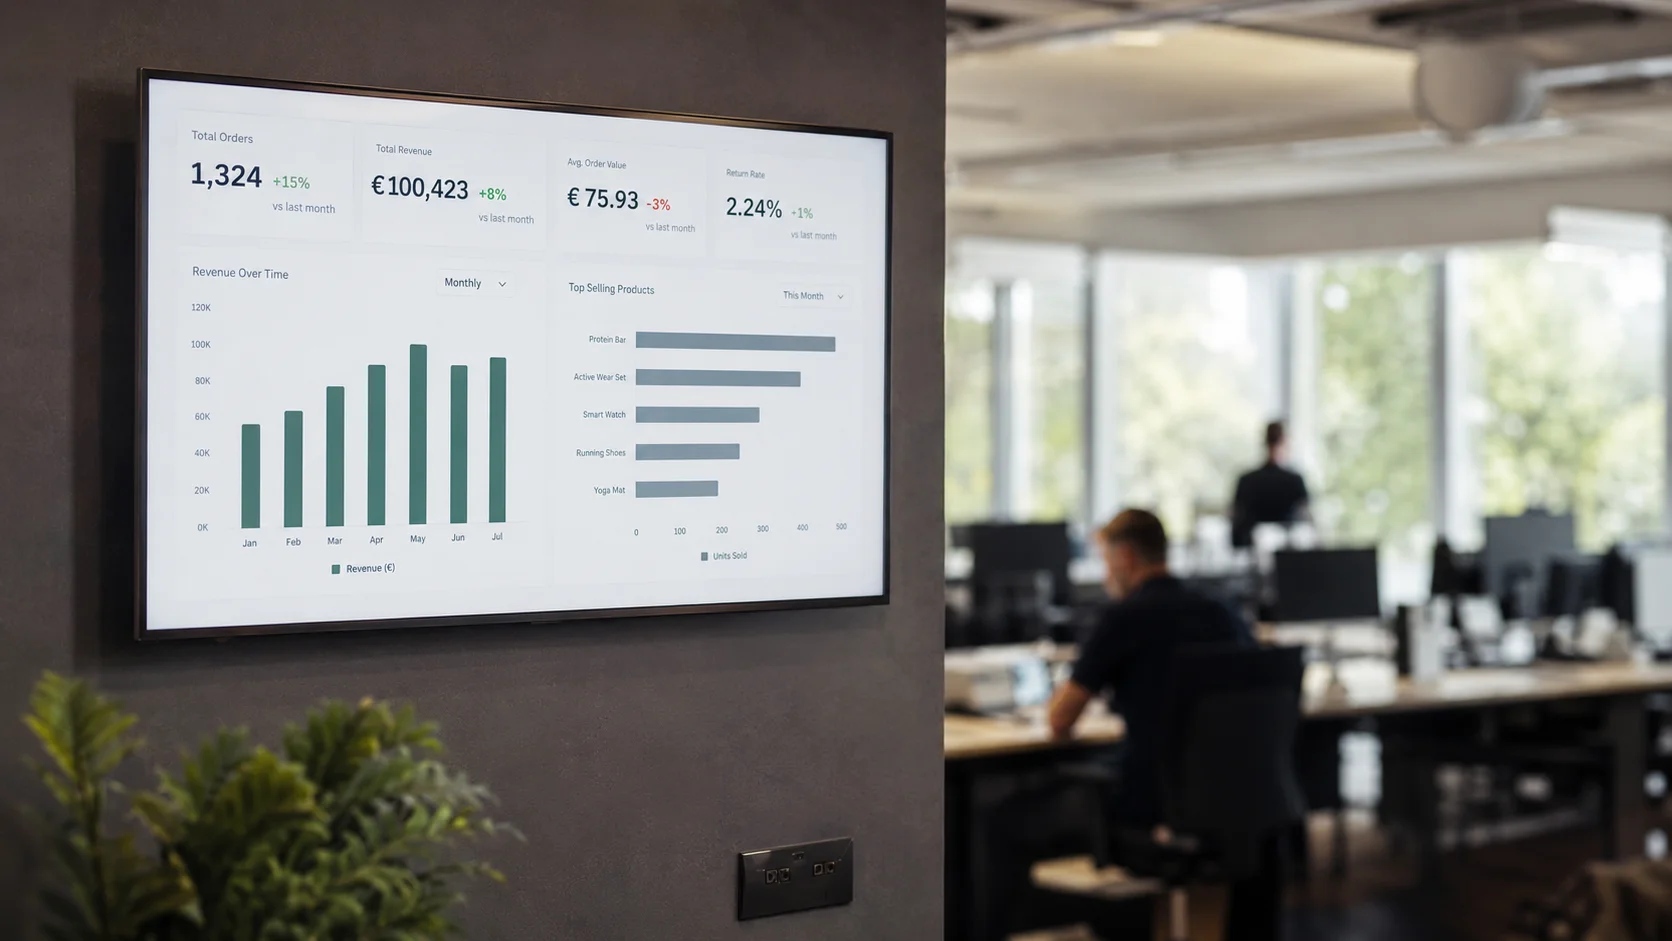
Our real time dashboard bridges this gap by automatically combining your point-of-sale data with your purchasing administration. With daily insights into your exact KPIs, you can confidently run strategic price promotions, monitor true Break-Even points, and protect your margins.