You have data in your ERP, data in your point-of-sale system, and data in Excel. But when someone asks how the business is doing this week, do you have to spend time looking it up across multiple platforms? If so, a KPI dashboard is exactly what you need.
What is a KPI dashboard?
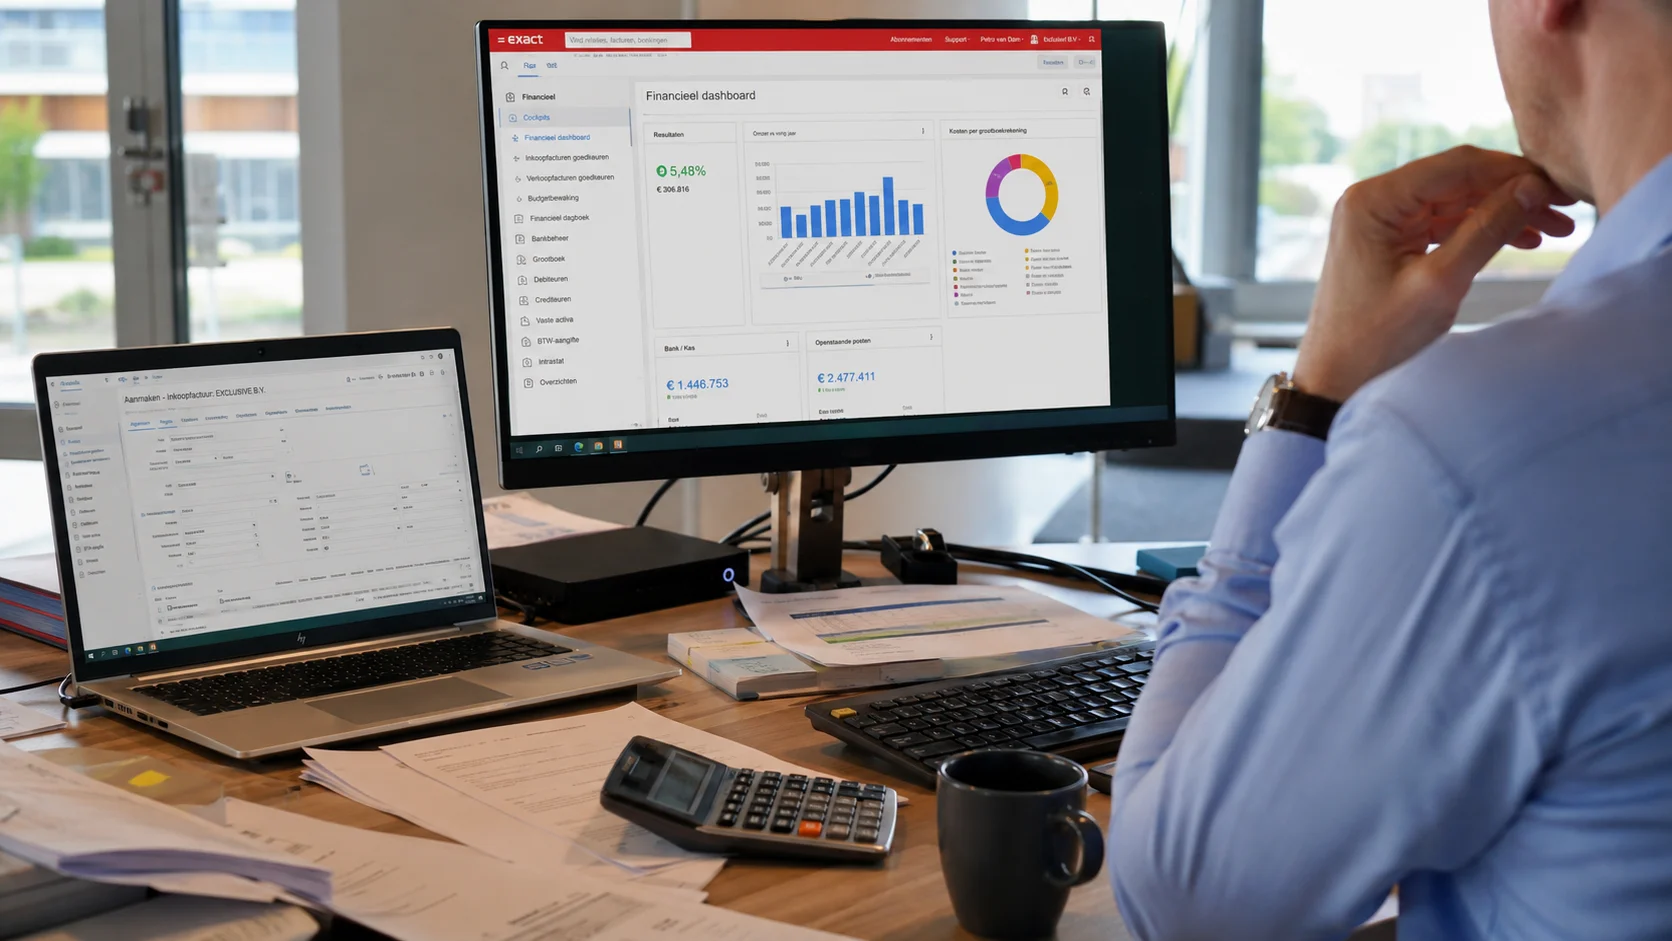
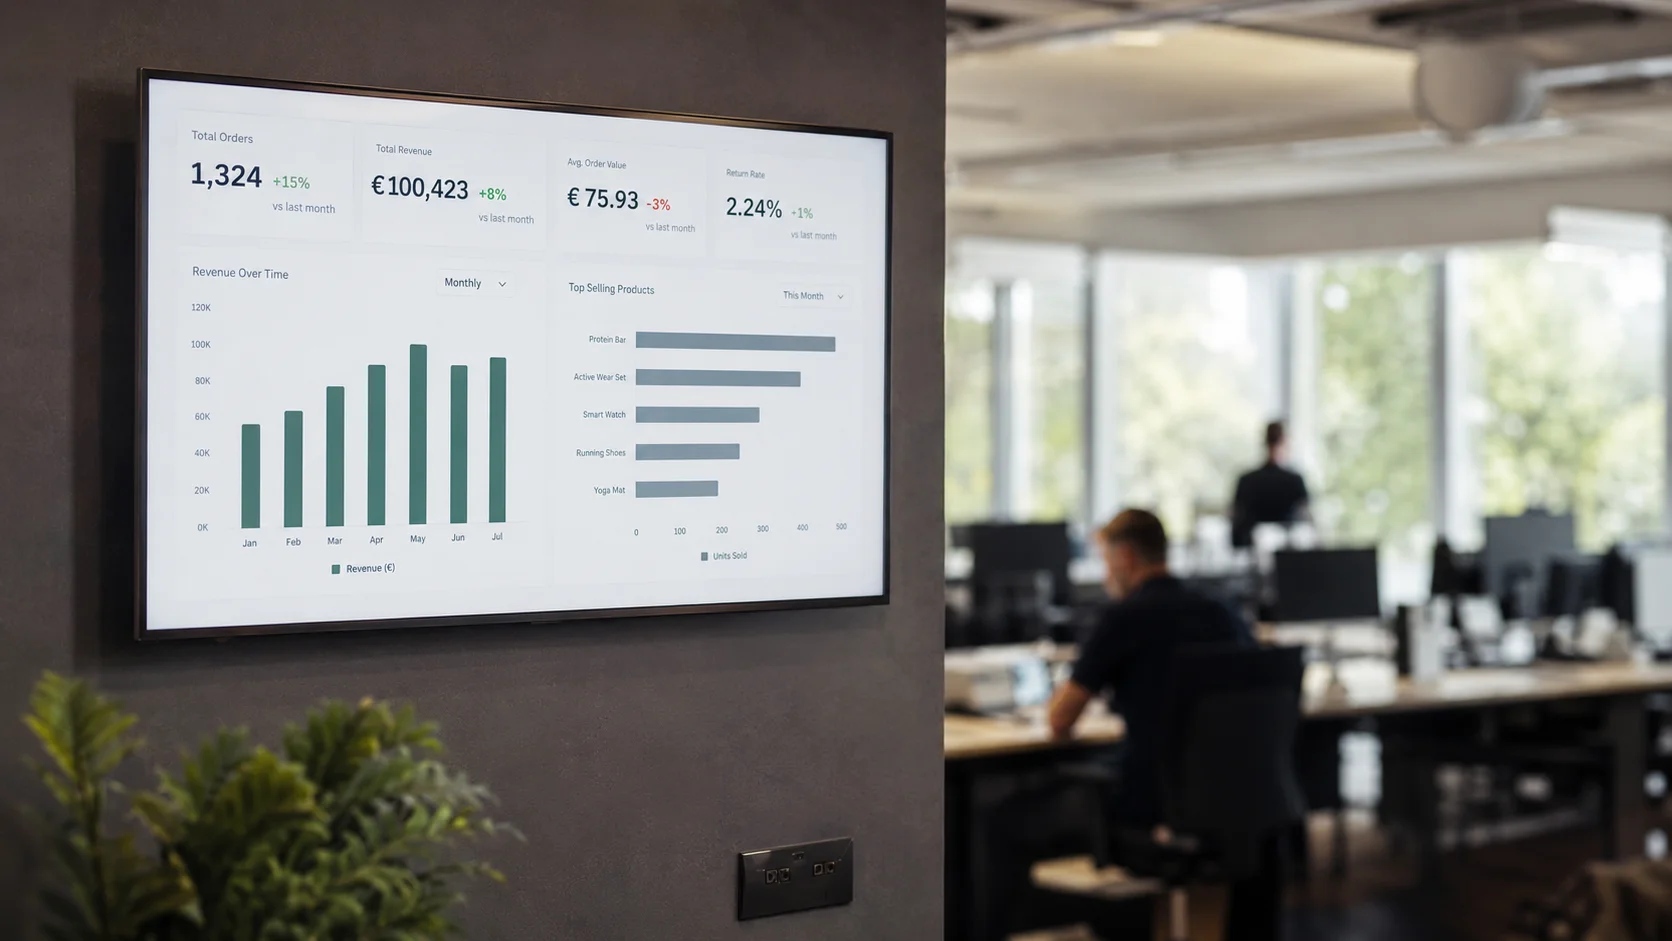
A KPI dashboard is a digital overview that displays your company's most important performance indicators in real time. Instead of manually running reports, you see at a glance how your business is performing.
KPI stands for Key Performance Indicator, which represents the measurable values that determine whether your company is meeting its targets. Common examples include revenue, profit margin, order progress, customer satisfaction, or productivity per employee.
Why is a dashboard useful for SMBs?
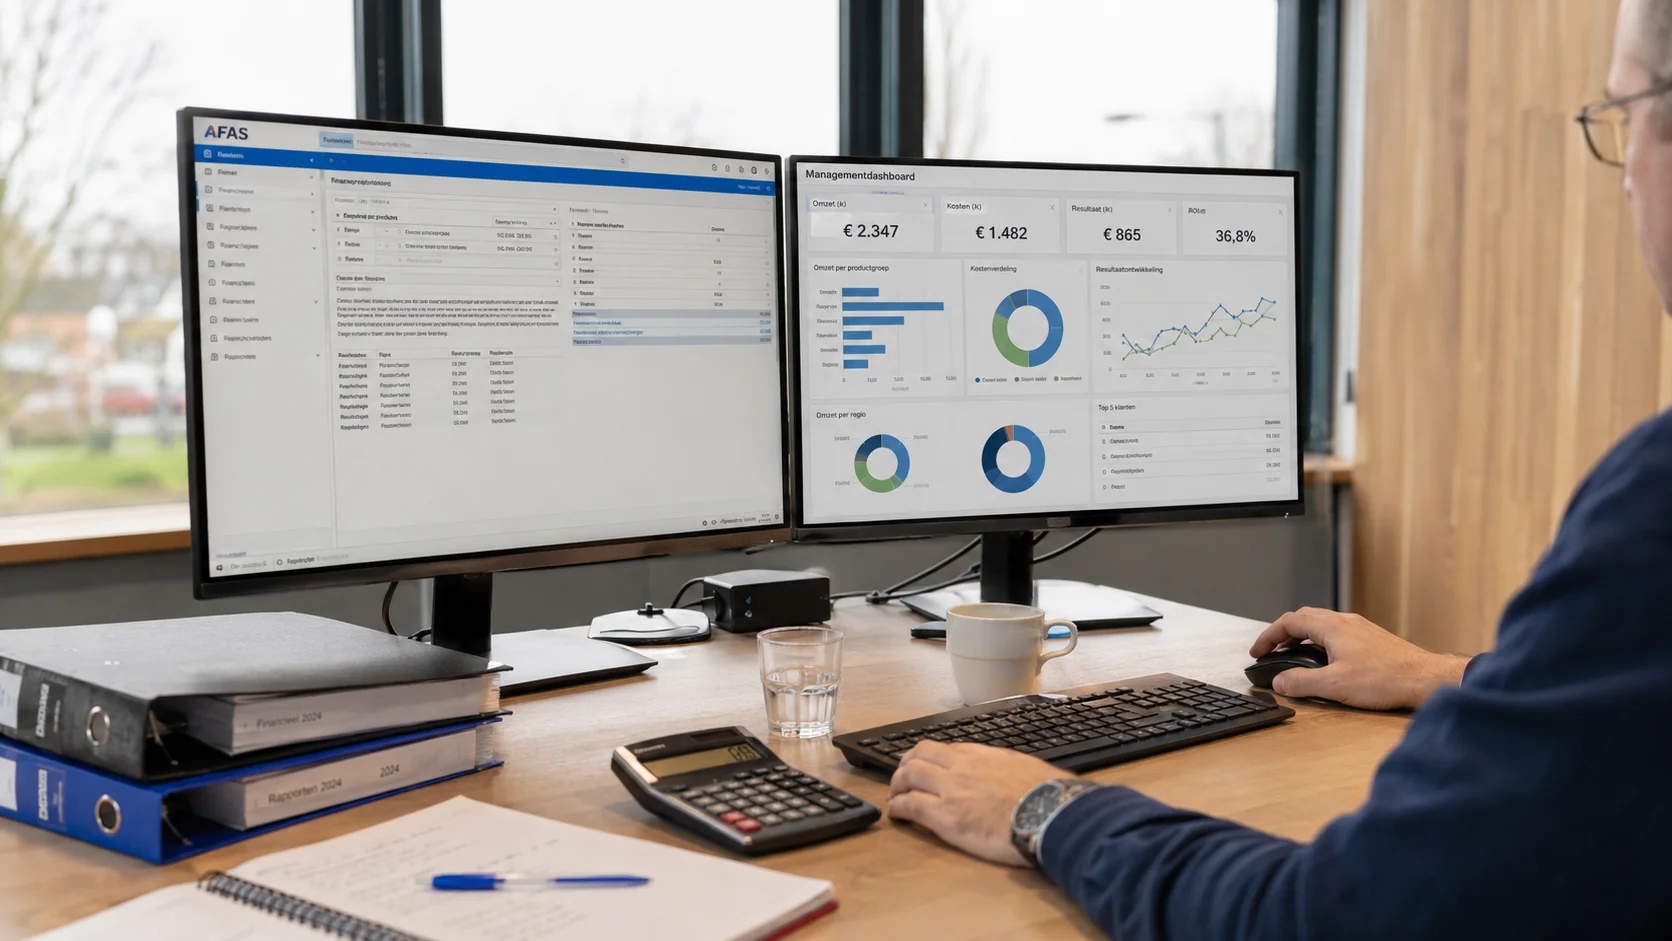
Many small and medium-sized businesses (SMBs) have data scattered across multiple systems, including ERPs, CRMs, Excel sheets, and point-of-sale software. A dashboard brings all that data together into a single source, making it visible for both you as a director and for your entire team.
8–16 hrs
is the average time an SMB spends per month manually compiling reports. A good dashboard reduces that time to virtually nothing.
Which KPIs do you put on a dashboard?
This depends on your sector and goals. Most commonly used KPIs per category:
- Financial: daily revenue, YTD revenue, gross margin, outstanding invoices
- Operational: order progress, delivery times, occupancy rate
- Manufacturing: OEE, scrap rate, machine utilization
- Sales: pipeline value, win rate, new leads per source
- Hospitality: average spend per cover, covers per shift, food cost
What makes a good dashboard?
- It only shows the KPIs that are truly relevant to your business
- It connects to your existing systems, no manual input
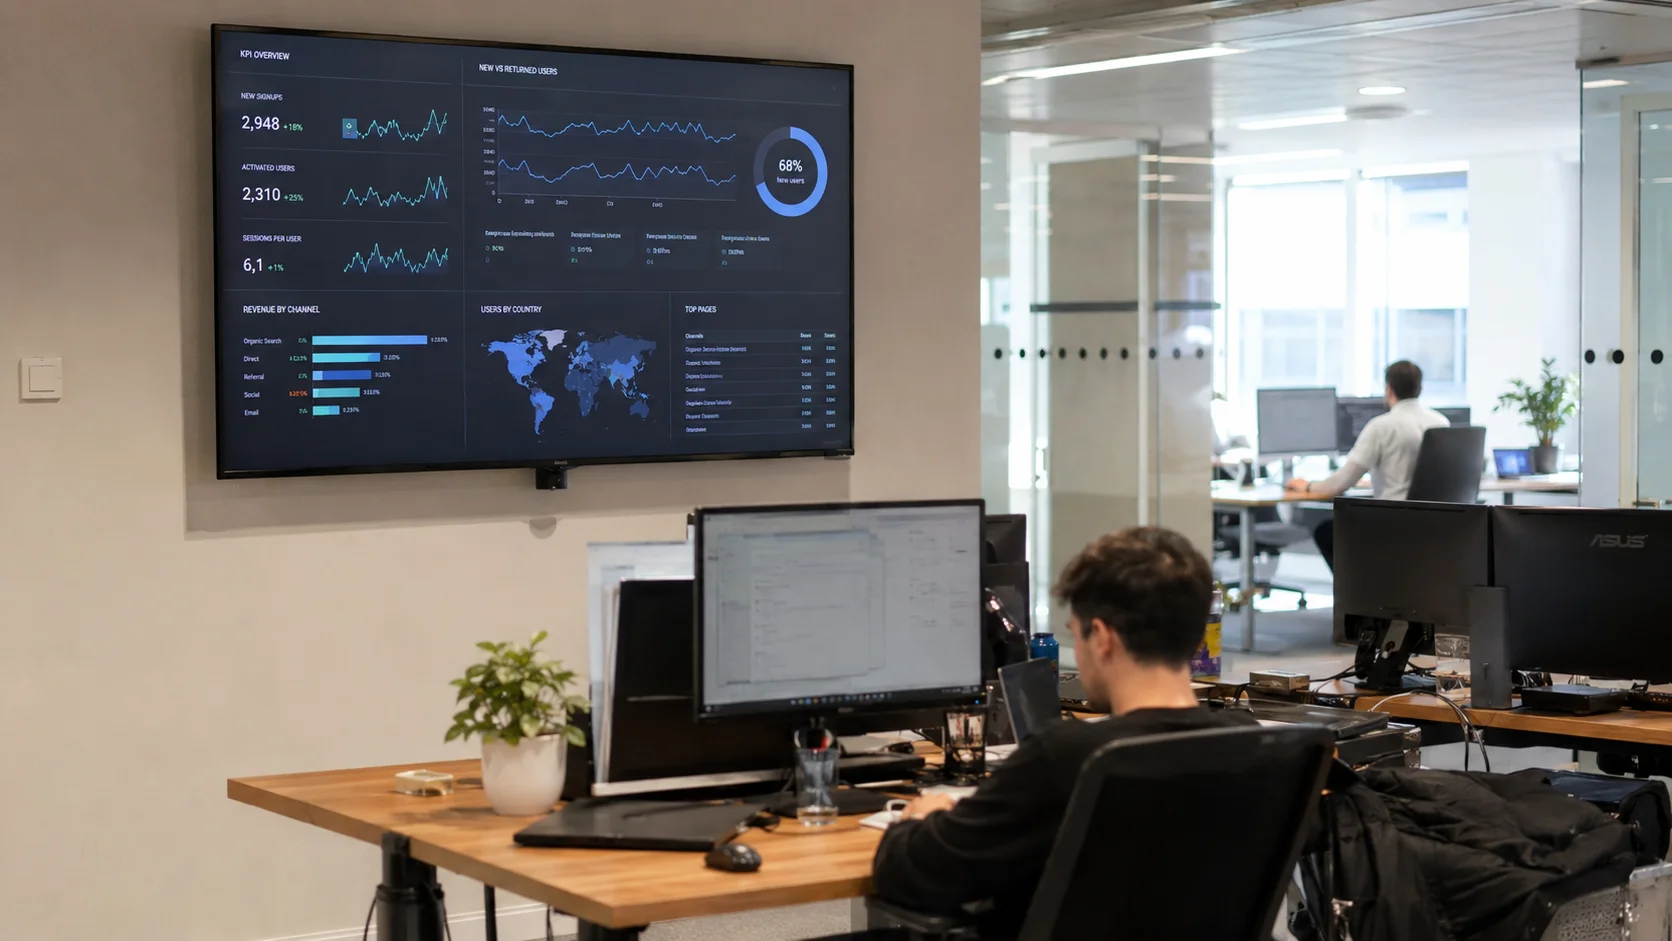
- It's always current, not a week old
- Everyone on the team can understand it without explanation
- It matches your company's brand and style
A dashboard is not a report. A report tells you how things were. A dashboard tells you how things are right now. That difference determines whether you're steering forward or looking backward.
How do you get started with a KPI dashboard?
Step 1: determine which questions you ask as a director every day.
Step 2: inventory which systems contain this data.
Step 3: choose a dashboard solution that can connect with those systems.
At Ralect we guide you through each of these steps and make sure the dashboard is fully set up before you go live.
Curious what your business would look like as a dashboard? Ralect builds a free demo dashboard based on your industry and systems. Schedule a call and see it within 24 hours.